


Time management is very much important in IIT JAM. The eduncle test series for IIT JAM Mathematical Statistics helped me a lot in this portion. I am very thankful to the test series I bought from eduncle.
Nilanjan Bhowmick AIR 3, CSIR NET (Earth Science)


- UGC NET
- Economics
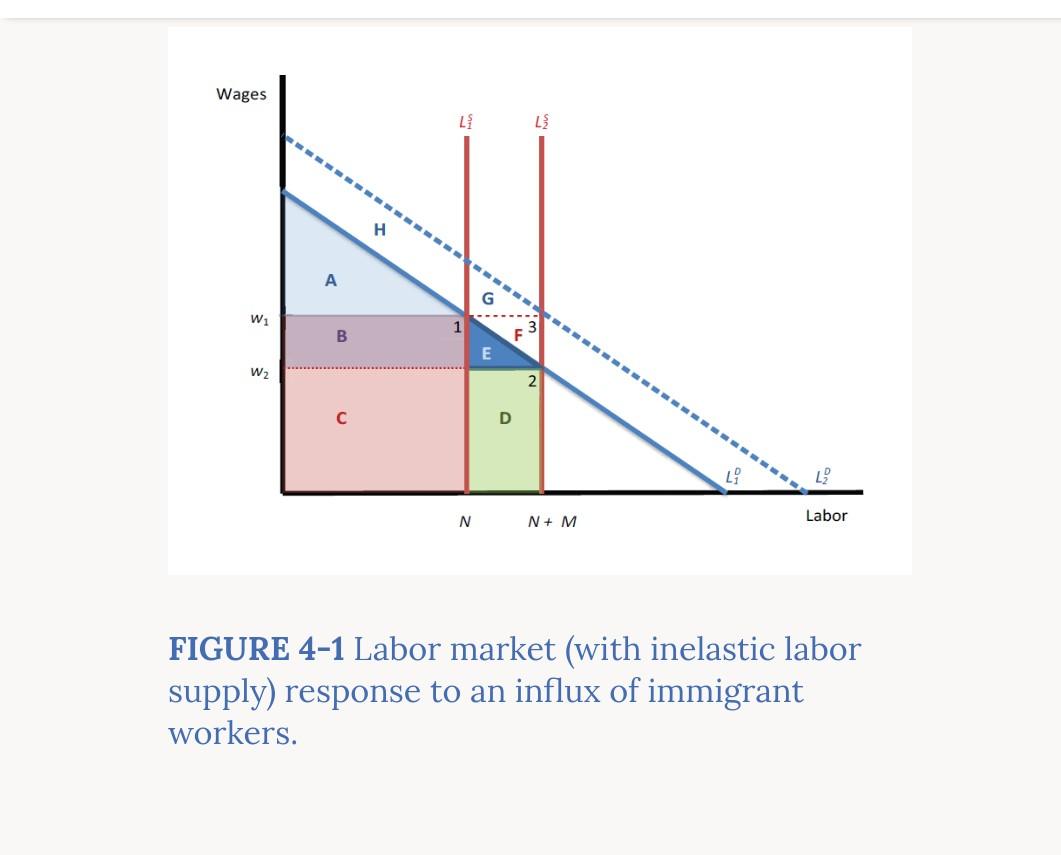
Unable to understand this. kindly help
(2) marginal rate of substitution (3) average rate of transformation )marginal rate of transformation Labour supply before immigration Real wage w B Labour supply after D immigration -X L"L L Employment The gain in profit income from an increase in immigration according to this diagram is 0the area BDLL 2) the area of WBDW (3) the areas WBFW and FDL'L together (4) the areas WBDW and FDL'L together 7. The demand for rare paintings, and rare stamps etc. is explained by whch among
2 Answer(s)
Answer Now
- 0 Likes
- 3 Comments
- 0 Shares
-
Reshma gupta
![best-answer]()
hi anushka,i am attaching a screenshot ,i hope it will make you .
![cropped6301471232232890395.jpg]()
![cropped482633537306792955.jpg]()
![cropped6255698385418190036.jpg]()
-
Reshma gupta
according to the question , before immigration real wage is w and employment or labour is l total wage = w*l OWBL but after immigration labour supply increased so real wage declined so after immigration total wage = OW'DL' so profit due to reduction in wage = OWBL- OW'DL'=WW'BD or WBDW'
![eduncle-logo-app]()
I didn't get it. area OW'LF is common in both cases so we ignore it. shouldn't the answer be something areaC - areaE ?
Do You Want Better RANK in Your Exam?
Start Your Preparations with Eduncle’s FREE Study Material
- Updated Syllabus, Paper Pattern & Full Exam Details
- Sample Theory of Most Important Topic
- Model Test Paper with Detailed Solutions
- Last 5 Years Question Papers & Answers
Sign Up to Download FREE Study Material Worth Rs. 500/-


Ravindra nath mahto![best-answer]()
Anushka, Look at my solution once, I hope you will understand it.