Time management is very much important in IIT JAM. The eduncle test series for IIT JAM Mathematical Statistics helped me a lot in this portion. I am very thankful to the test series I bought from eduncle.
Nilanjan Bhowmick AIR 3, CSIR NET (Earth Science)
Imdadul Haque posted an Question
- IIT JAM
- Chemistry (CY)
25. the maxwell-boltzman distribution for molecular speed is shown in the following figure. f(u)| w l u in the figure, h is the highest of the peak, l. is the l
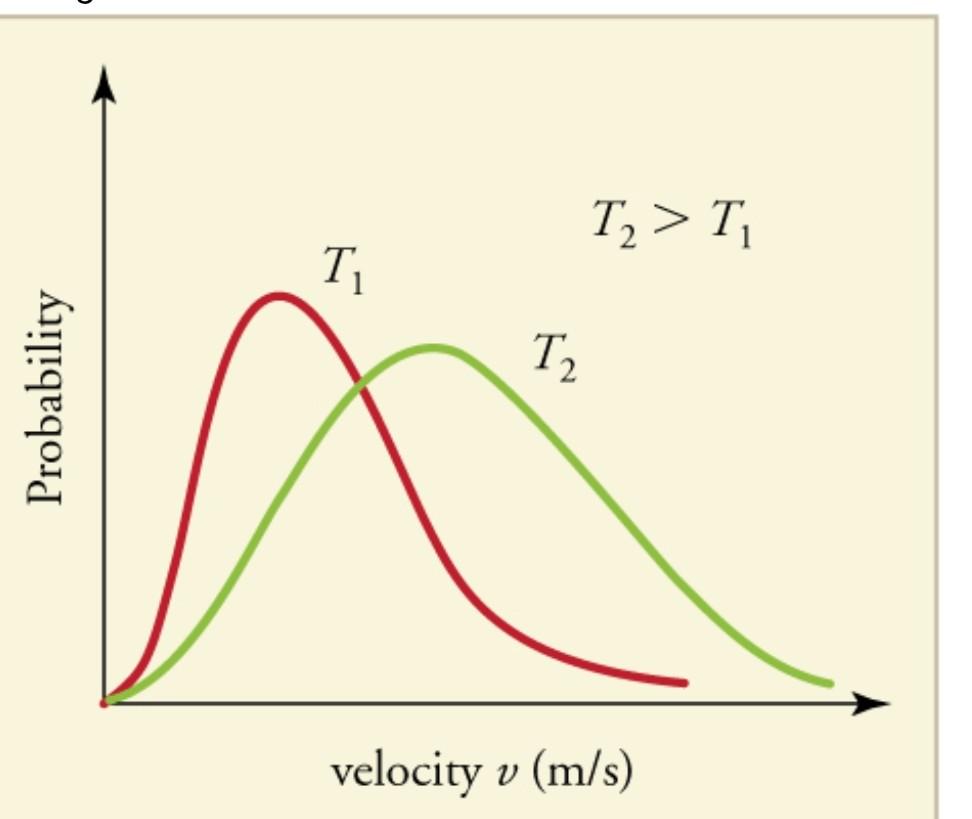
25. The Maxwell-Boltzman distribution for molecular speed is shown in the following figure. f(u)| W L u In the figure, H is the highest of the peak, L. is the location of the maximum & W is the width at half height as the temperature is decreased. 26. For the given Maxwell curve at three different temperatures 300 K, 600 K, 900 K respectively for a particular gas. 00 900 Select the correct statement a. The area under the curve at 900 Kis less than that at 600 K b. The area under thne three curves is Salne . the total traction occupied by the gas atthese three temperature is same. d. the maximum fraction occupied by the gas at these temperature is same. 27. Consider the given curve ( The correct relationship among Ti & T2 is: b. Ta> Ti a. Ta« T C.Ti 12 d.Can't be predicted. (1) The area abcd represents. . Number of molecules having speed between a and b . Fraction of molecules having speed between a andb. . Number of molecules having speed less than Ump d. Fraction of molecules having speed less than Ump
- 0 Likes
- 3 Comments
- 0 Shares
-
![comment-profile-img]() >
>
-
![comment-profile-img]() >
>
-
![comment-profile-img]() >
>
Do You Want Better RANK in Your Exam?
Start Your Preparations with Eduncle’s FREE Study Material
- Updated Syllabus, Paper Pattern & Full Exam Details
- Sample Theory of Most Important Topic
- Model Test Paper with Detailed Solutions
- Last 5 Years Question Papers & Answers
Sign Up to Download FREE Study Material Worth Rs. 500/-


 >
>


Priyanshu kumar
check all previous pending questions