
 >
>
 >
>


Time management is very much important in IIT JAM. The eduncle test series for IIT JAM Mathematical Statistics helped me a lot in this portion. I am very thankful to the test series I bought from eduncle.
Nilanjan Bhowmick AIR 3, CSIR NET (Earth Science)


Imdadul Haque posted an Question
January 01, 2021 • 00:32 am
![]() 30 points
30 points
- IIT JAM
- Chemistry (CY)
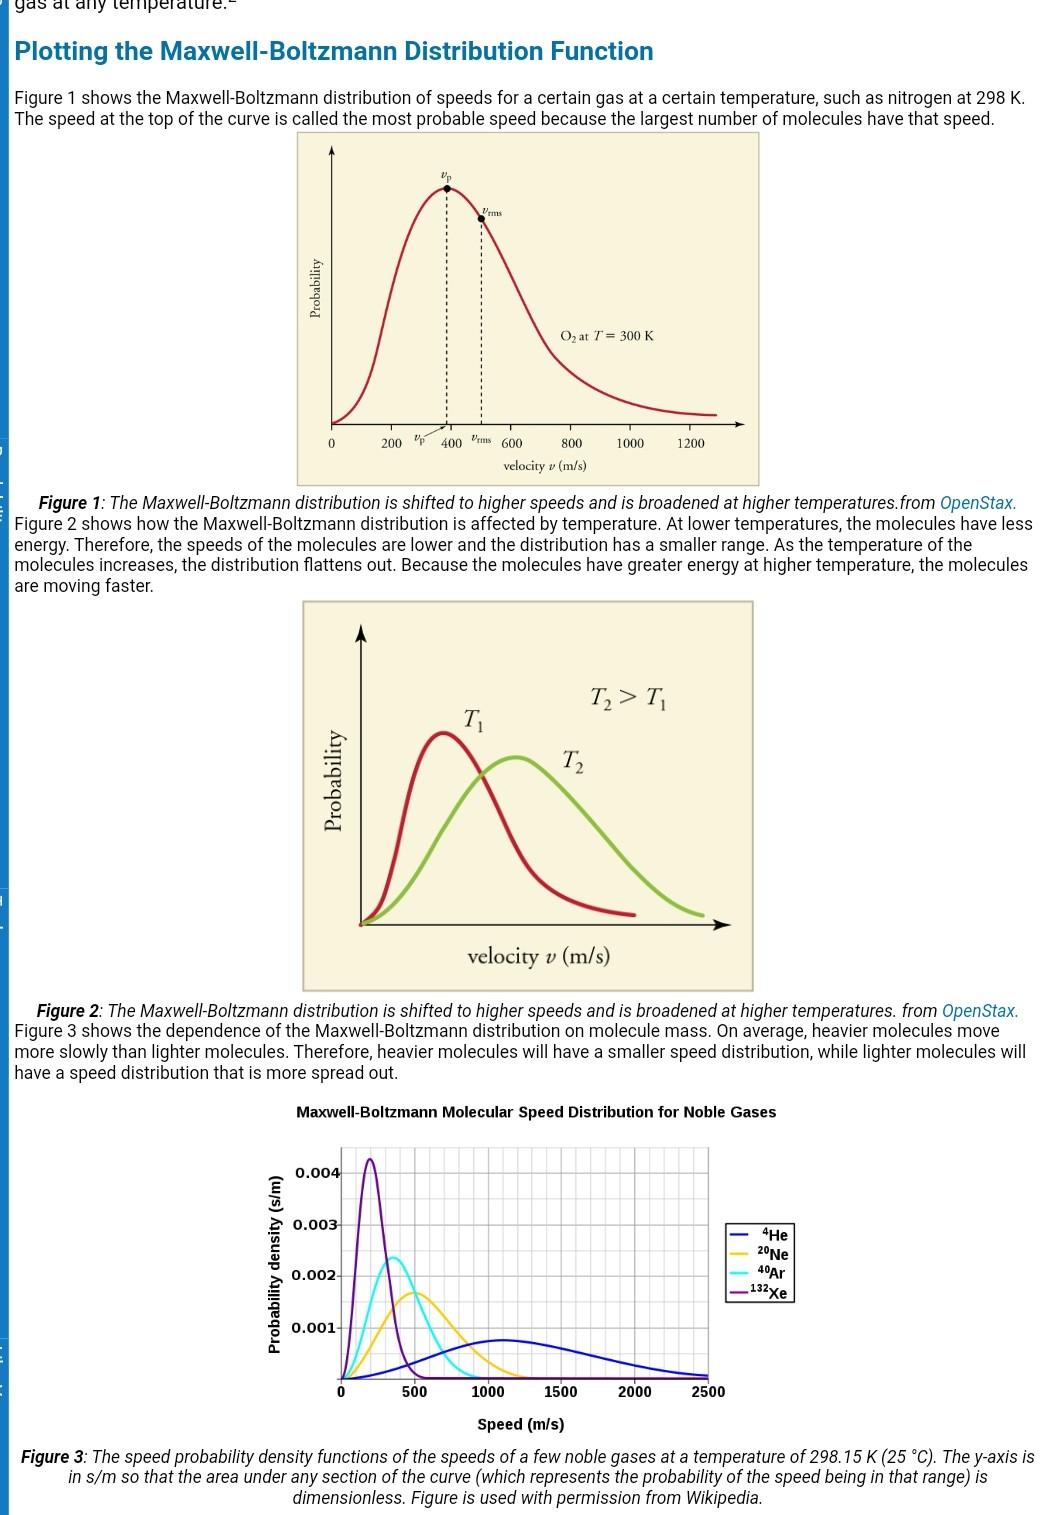
Duncle chemistry (usp-3) which of the following graphs best represents the maxwell distribution of molecular speeds and its dependence on temperature? low high
duncle Chemistry (USP-3) Which of the following graphs best represents the Maxwell distribution of molecular speeds and its dependence on temperature? Low High temperature temperature (A) (B) (P, const.) speed speed High temperature Low temperature - (C) (D) speed speed
3 Answer(s)
Answer Now
- 0 Likes
- 3 Comments
- 0 Shares
Do You Want Better RANK in Your Exam?
Start Your Preparations with Eduncle’s FREE Study Material
- Updated Syllabus, Paper Pattern & Full Exam Details
- Sample Theory of Most Important Topic
- Model Test Paper with Detailed Solutions
- Last 5 Years Question Papers & Answers
Sign Up to Download FREE Study Material Worth Rs. 500/-


Suman Kumar![best-answer]()
see option C is correct