


Time management is very much important in IIT JAM. The eduncle test series for IIT JAM Mathematical Statistics helped me a lot in this portion. I am very thankful to the test series I bought from eduncle.
Nilanjan Bhowmick AIR 3, CSIR NET (Earth Science)


L.sufiya Khanam posted an Question
November 19, 2020 • 22:50 pm
![]() 30 points
30 points
- IIT JAM
- Mathematics (MA)
Explanation
... 👆🏾👆🏾👆🏾👆🏾👆🏾👆🏾👆🏾👆🏾👆🏾👆🏾👆🏾
2 Answer(s)
Answer Now
- 1 Likes
- 4 Comments
- 0 Shares
Do You Want Better RANK in Your Exam?
Start Your Preparations with Eduncle’s FREE Study Material
- Updated Syllabus, Paper Pattern & Full Exam Details
- Sample Theory of Most Important Topic
- Model Test Paper with Detailed Solutions
- Last 5 Years Question Papers & Answers
Sign Up to Download FREE Study Material Worth Rs. 500/-


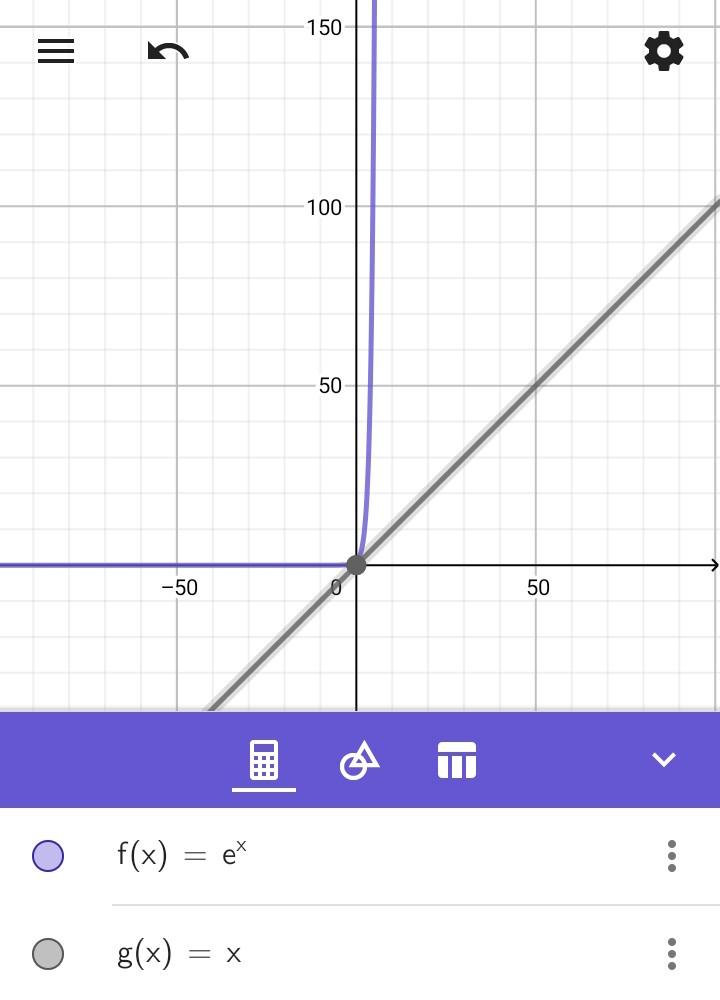
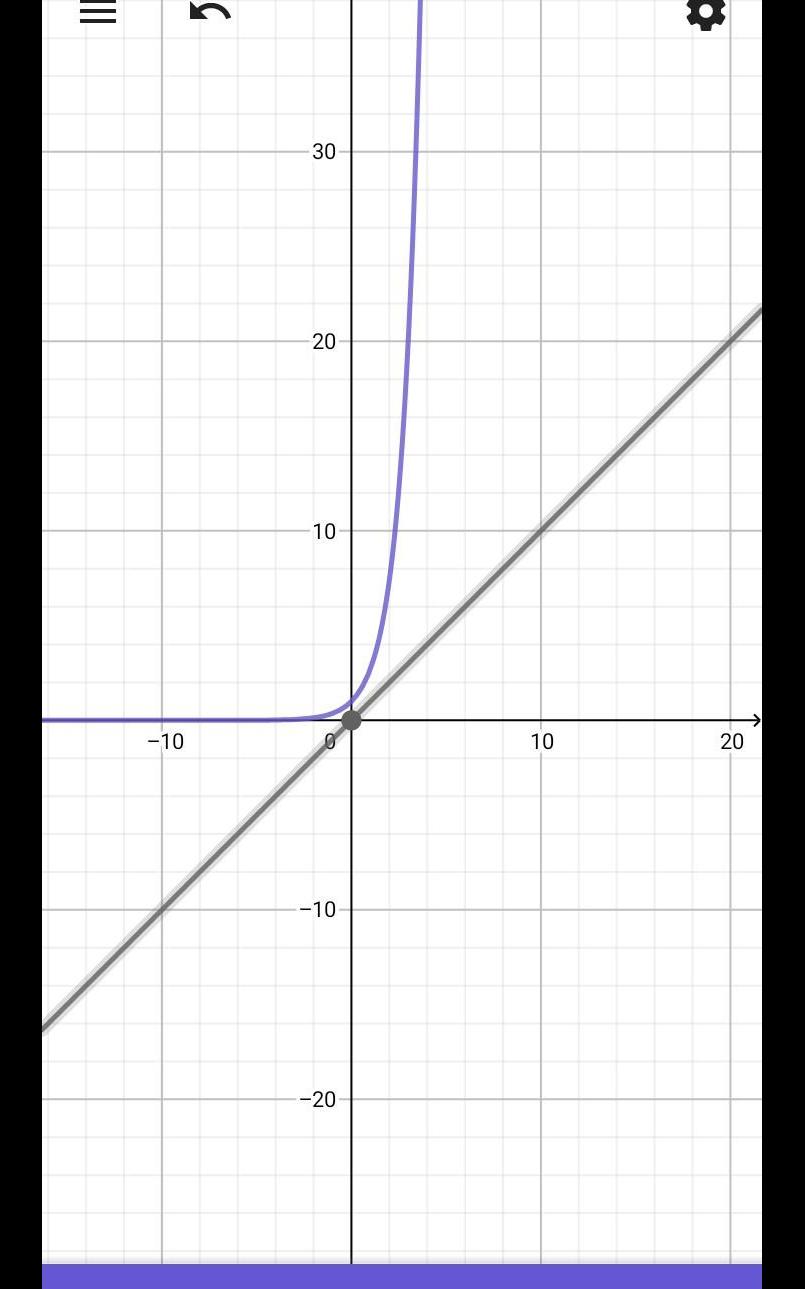
Anonymous User Best Answer
graph of e^x and x . the blue line is graph of e^x and grey line is graph of x