


Time management is very much important in IIT JAM. The eduncle test series for IIT JAM Mathematical Statistics helped me a lot in this portion. I am very thankful to the test series I bought from eduncle.
Nilanjan Bhowmick AIR 3, CSIR NET (Earth Science)


- IIT JAM
- Physics (PH)
For the given v-t graph, find out a-t and s-t graph. label each axis with the proper values. 11m/s 4 m/s t=0 t=10s t-20s -2 m/s
1 Answer(s)
Answer Now
- 0 Likes
- 3 Comments
- 0 Shares
-
Sachin
I am travelling so cant plot it on a paper. this is a-t curve. take red line 0-10 and blue line for 10-20 as the slope of the line is -1.3
![cropped497259007288757088.jpg]()
-
Sachin
![best-answer]()
this is a v-t curve. differentiation of this curve will give us a-t curve. just take the slope at each point and plot it with respect to t. for s-t curve you need to integrate it and keep adding the area under the curve and plot it.
Do You Want Better RANK in Your Exam?
Start Your Preparations with Eduncle’s FREE Study Material
- Updated Syllabus, Paper Pattern & Full Exam Details
- Sample Theory of Most Important Topic
- Model Test Paper with Detailed Solutions
- Last 5 Years Question Papers & Answers
Sign Up to Download FREE Study Material Worth Rs. 500/-


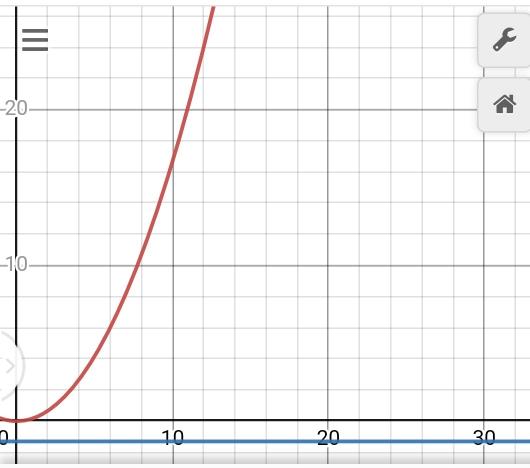
Sachin
this is s-t curve. 0-10 take red line s increases with t. 10-17approx. take blue line and purple line when velocity becomes negative the displacement reduces.