
 >
>


Time management is very much important in IIT JAM. The eduncle test series for IIT JAM Mathematical Statistics helped me a lot in this portion. I am very thankful to the test series I bought from eduncle.
Nilanjan Bhowmick AIR 3, CSIR NET (Earth Science)


Feynman Fan posted an Question
August 27, 2020 • 22:15 pm
![]() 30 points
30 points
- IIT JAM
- Physics (PH)
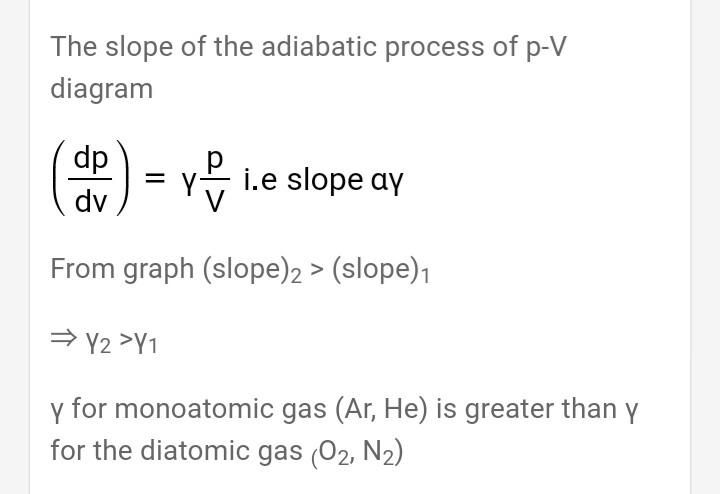
P-v plots for two gases helium and oxygen during adiabatic processes are shown in the figure below. which plot corresponds to which gas
Question Number 14 Report P-V plots for two gases during adiabatic processes are shown in the figure below. Plots 1 and 2 should correspond respectively to
2 Answer(s)
Answer Now
- 0 Likes
- 4 Comments
- 0 Shares
Do You Want Better RANK in Your Exam?
Start Your Preparations with Eduncle’s FREE Study Material
- Updated Syllabus, Paper Pattern & Full Exam Details
- Sample Theory of Most Important Topic
- Model Test Paper with Detailed Solutions
- Last 5 Years Question Papers & Answers
Sign Up to Download FREE Study Material Worth Rs. 500/-


Ruby negi
curve 1 is for O2 and 2 for He.. as slope of he is greater than o2