
 >
>
 >
>


Time management is very much important in IIT JAM. The eduncle test series for IIT JAM Mathematical Statistics helped me a lot in this portion. I am very thankful to the test series I bought from eduncle.
Nilanjan Bhowmick AIR 3, CSIR NET (Earth Science)


- IIT JAM
- Geology (GG)
Question below
2 Answer(s)
Answer Now
- 1 Likes
- 3 Comments
- 0 Shares
-
![comment-profile-img]() >
>
-
![comment-profile-img]() >
>
Sajan sarthak
![best-answer]()
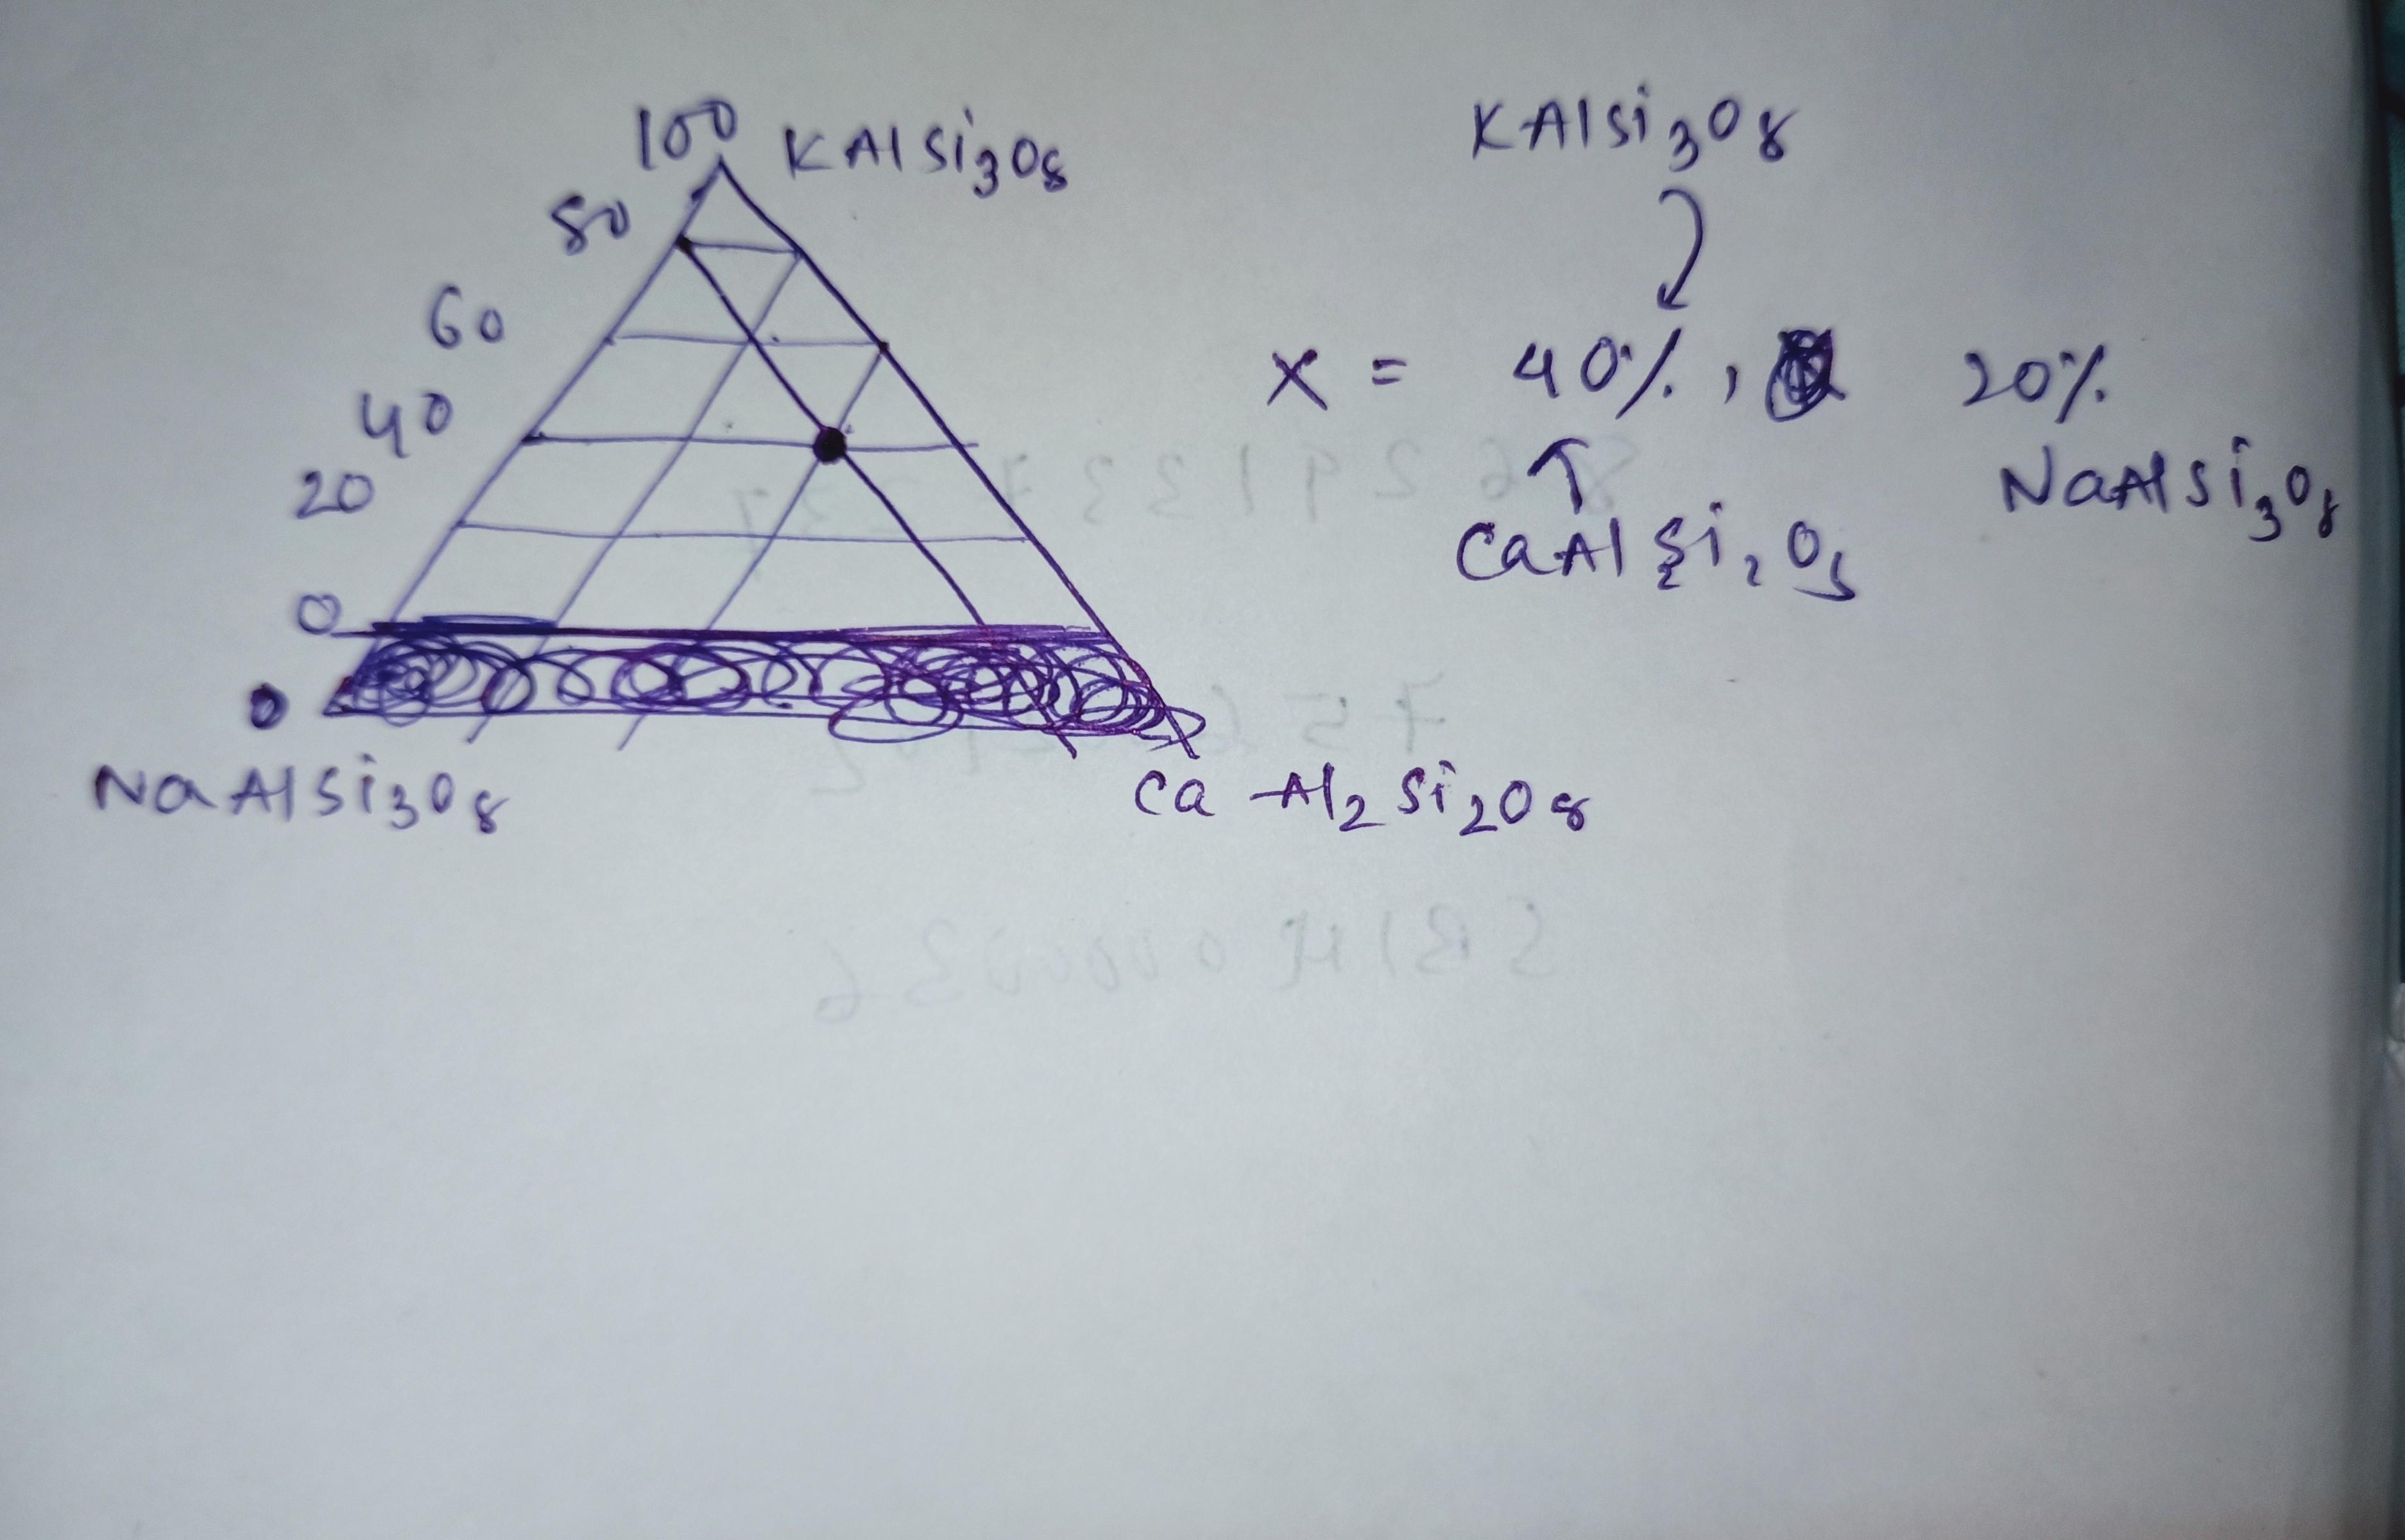
albite has least that is 20 percentage other two are same 40%
![cropped6987543564150424362.jpg]()
-
![comment-profile-img]() >
>
Do You Want Better RANK in Your Exam?
Start Your Preparations with Eduncle’s FREE Study Material
- Updated Syllabus, Paper Pattern & Full Exam Details
- Sample Theory of Most Important Topic
- Model Test Paper with Detailed Solutions
- Last 5 Years Question Papers & Answers
Sign Up to Download FREE Study Material Worth Rs. 500/-


Rahul kumar Best Answer
As you can see that the whole triangular plot is divided into 5 grids for each phase i.e. each grid represents 20% composition. For example on CaAl2Si2O8 and KAlSi3O8 line, the mole % of NaAlSi3O8 is 0, but as you move towards the NaAlSi3O8, the mole% of NaAlSi3O8 is increasing. After one grid line the mole% of NaAlSi3O8 will be 20% then on second line mole% will be 40% and so on. In simple words since point X is farthest from NaAlSi3O8, so the mole% of NaAlSi3O8 will be least in rock X.